Reports
The Reports page allows you to get useful insights on your restaurant business. It provides important data that you can use to develop future marketing plans and strategies, forecasts, to plan your budget and improve your service. This data will allow you to analyze and work upon the strengths and weaknesses of your business, to stay ahead of the competition.
Go to the GoParrot Dashboard and click Reports. On the top of the page, you will see various tabs, containing important statistical data, that you can view anytime you want.
The Report page can be accessed both on Merchand Level or by Location. On Merchant level you will have additional possibilities to select and view data on one, some or All your locations, as well as to access various comparative data (e.g Item Sales Comparison, Discounts Comparison, etc.)
Reports Tabs#
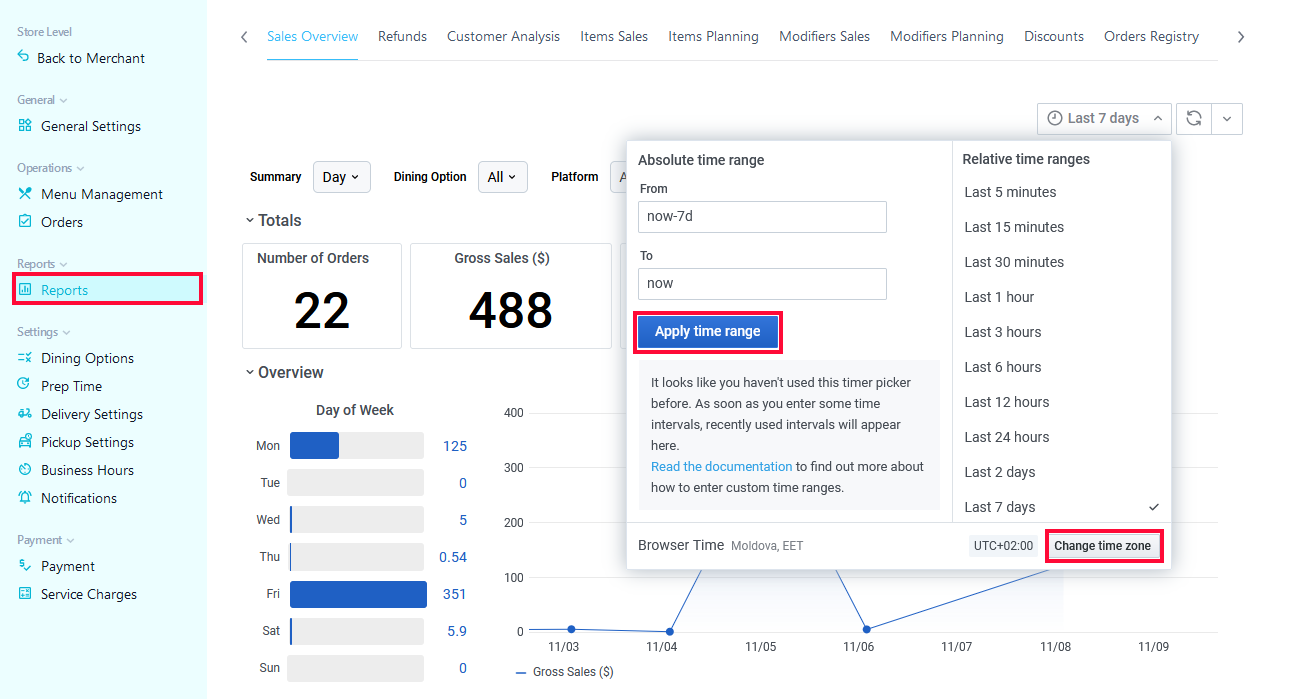
At the top-right corner of the screen you can find the Time Picker. In the pop-up window, you can select and apply the Absolute Time Range by entering the time intervals manually and by pressing Apply Time Range button. Or you can choose from the drop-down list a predetermined Relative Time Range (e.g. Last 24 hours, Last 7 days, Last 6 months, Last 2 years, etc.). For additional information how to enter custom time ranges click here.
The time interval is shown according to your local browser time or you can Change Time Zone by pressing the button in the left bottom corner of this window.
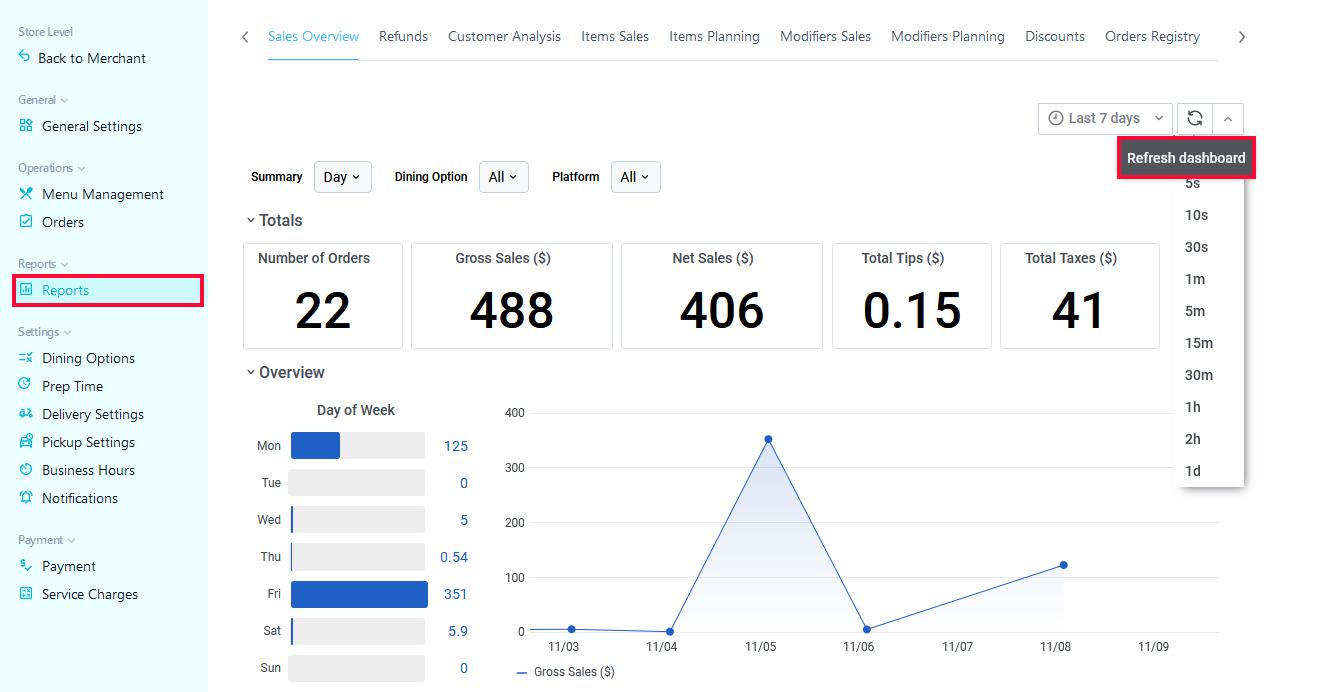
You can also click Refresh Dashboard to view the most current data. From the drop-down list you can switch this option off or you can choose a certain time interval that will refresh your data (30s, 30m, 1day, etc.)
Sales overview
The sales summary report based on various attributes and time periods.
On the left side there are four filters that allow you to select manually:
Locations – select from the list All, one or some of your restaurants/ stores.
Summary – select one of the given time intervals (Day, Week, Month).
Dining Option - select from the list All or one of the dining options (Curbside, Delivery, Dine-In, etc.)
Platform – select from the list All or one of the platforms that customers used to place the order (Desktop Browser, Android App, Mobile Browser, etc.)

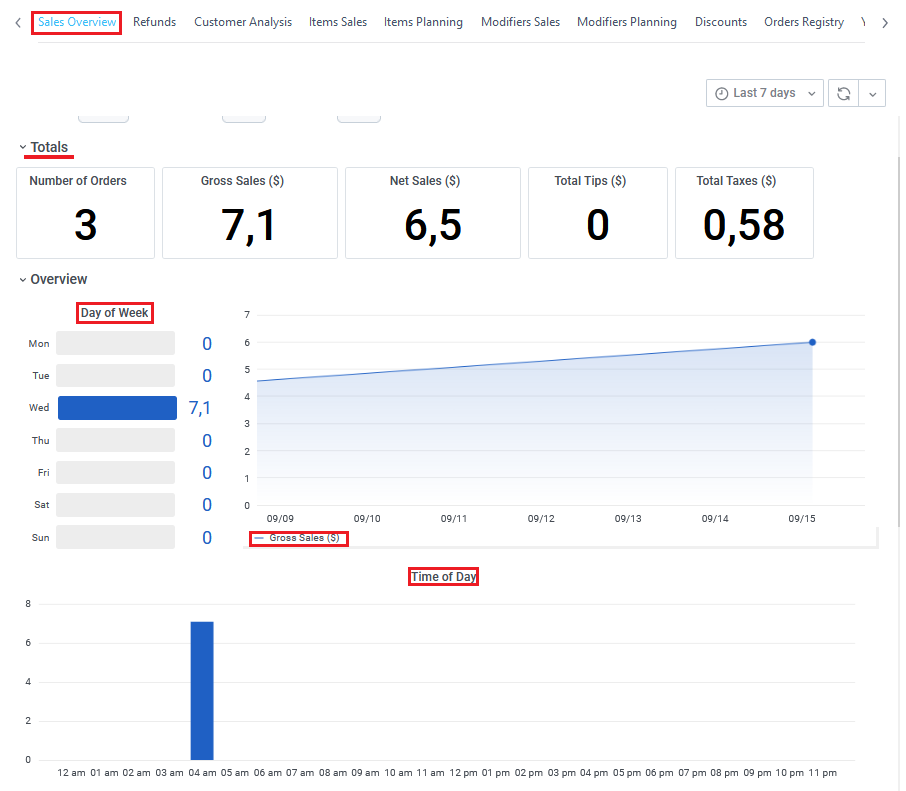
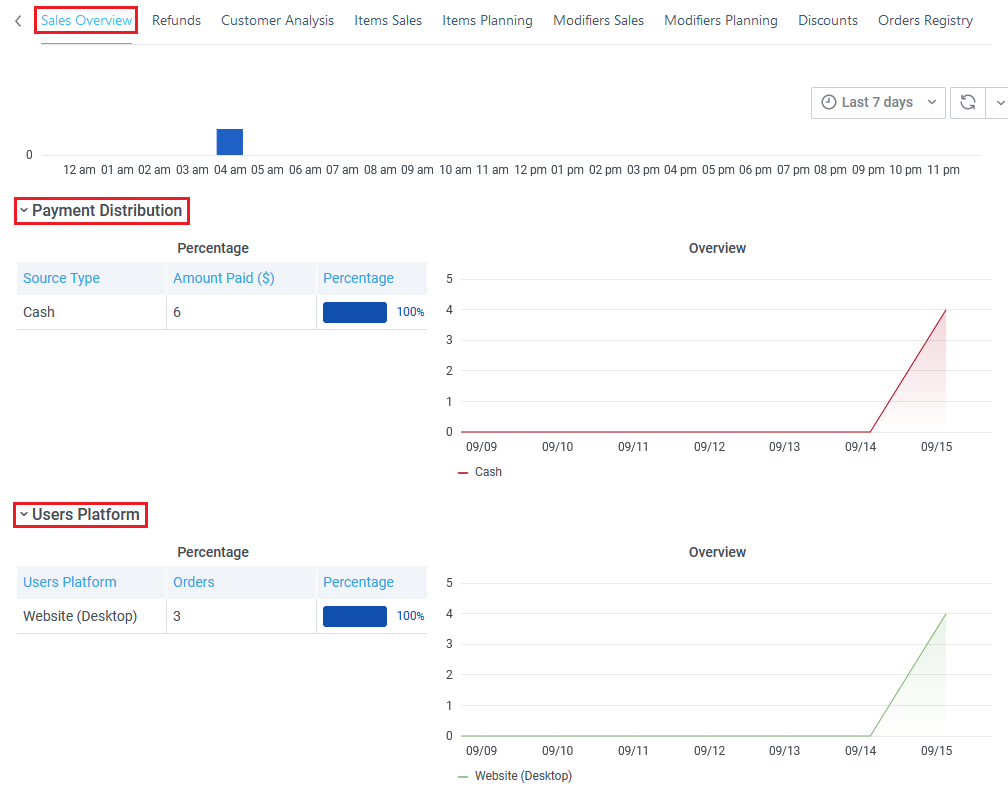
According to selected parameters, this page will generate five panels containing following data:
- Number of Orders;
- Gross Sales;
- Net Sales;
- Total Tips;
- Total Taxes.
Below there are 3 graphs.
- The first one shows by Day of the Week the amount of Gross sales during the time period you selected, as well as the sales breakdown per each hour.
2. Payment Distribution graph shows the source type (cash, credit card), the amount paid in $ and the percentage.
3. Users Platform graph shows the number of orders made from a certain platform and the percentage.
Sales Comparison
Comparative analyses of your sales in various locations. Define the required time interval using Time Picker and select from the list All, one or some of your Locations.
The panel below provides you with the following data:
- Total Orders – the total amount of orders fulfilled in selected time interval.
- Gross Sales ($) - the grand total of all sales.
- Net Sales ($) - the sum of gross sales minus its returns, allowances, and discounts.
- Total Taxes ($) – total amount of taxes and mandatory contributions payable by your business.
- Total Tips ($) – total number of tips paid by the customers.

Refunds
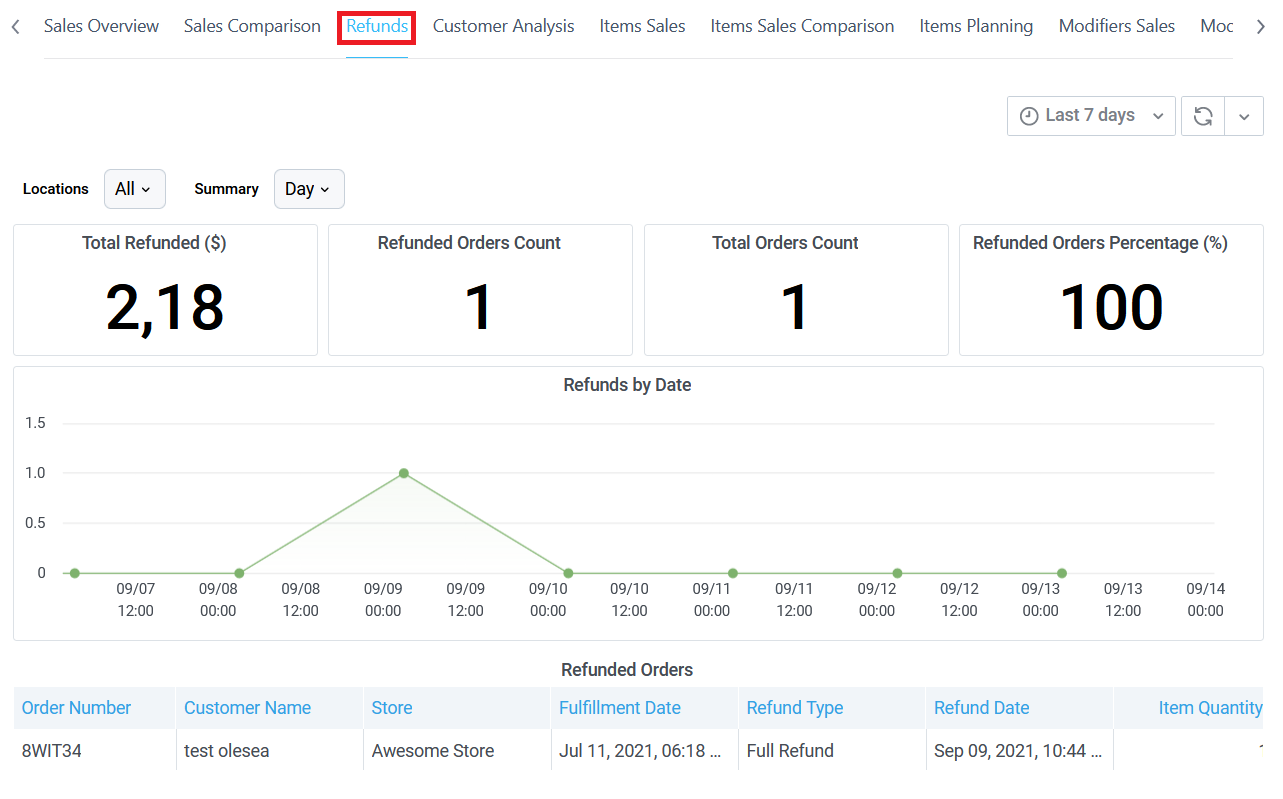
Statistical data on orders refunded to your customers. Define the required time interval using Time Picker, select from the list All, one or some of your Locations.
Report on refunded orders:
- Total Refunded – the total amount of $ that were refunded to your customers.
- Refunded Orders Count – the number of orders that have been refunded.
- Total Orders Count – the total number of orders fulfilled in the given time interval.
- Refunded Orders Percentage – the ratio (percentage) of refunded orders against the total amount of fulfilled orders.
The graph below provides statistical data on refunded orders by date, followed by a detailed list of all your refunds that contains:
- Order Number;
- Customer Name;
- Location;
- Fulfillment Date;
- Refund Type (partial or full);
- Refund Date;
- Item Quantity;
- Order Total;
- Refunded Amount.
Customer Analysis
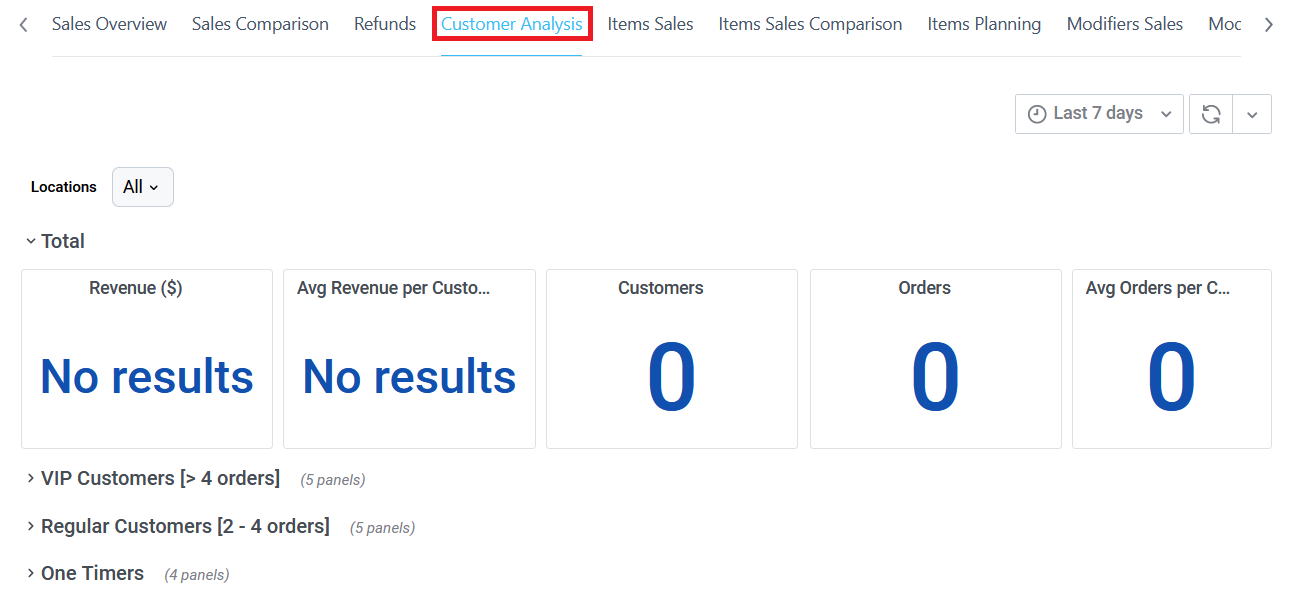
Statistical data on various categories of customers. Define the required time interval using Time Picker, select from the list All, one or some of your Locations.
The customers are divided into four categories:
- Total number of customers;
- VIP Customers that placed 4 orders and more;
- Regular Customers [2 - 4 orders] and;
- One Timers.
For each of these categories, the following data is provided:
- Revenue ($) – the total amount of income brought by a certain category of customers.
- Average Revenue for Customer – the total amount of revenue in a given time interval divided by the number of customers.
- Customers – the total number of customers who placed an order in your restaurant.
- Orders – the total amount of orders placed by customers in a certain category.
- Average Orders per Customer – the total number of orders divided by the number of customers.
Items Sales
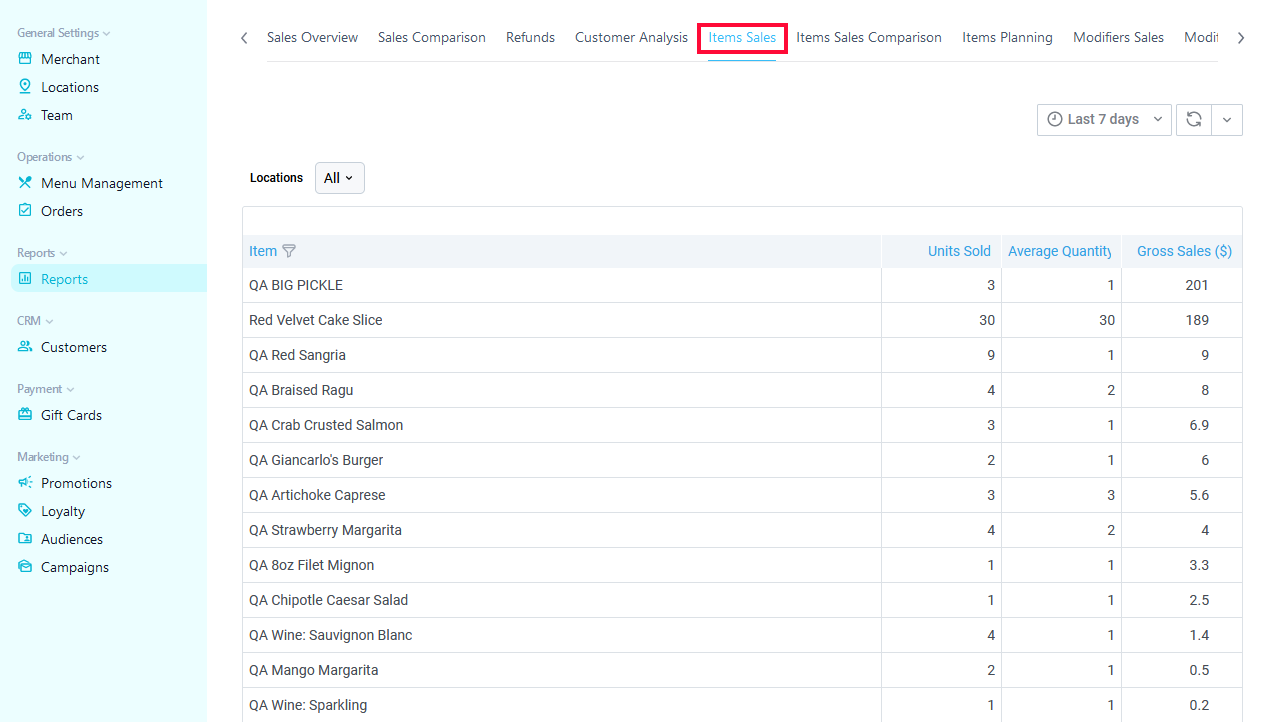
Statistical data on various menu items sold on your online store. Define the required time interval using Time Picker. Select from the list All, one or some of your Locations.
You can view the list of items, as well as the following data: number of Units Sold, Average Quantity in the Order and Gross Sales ($).
Item Sales Comparison
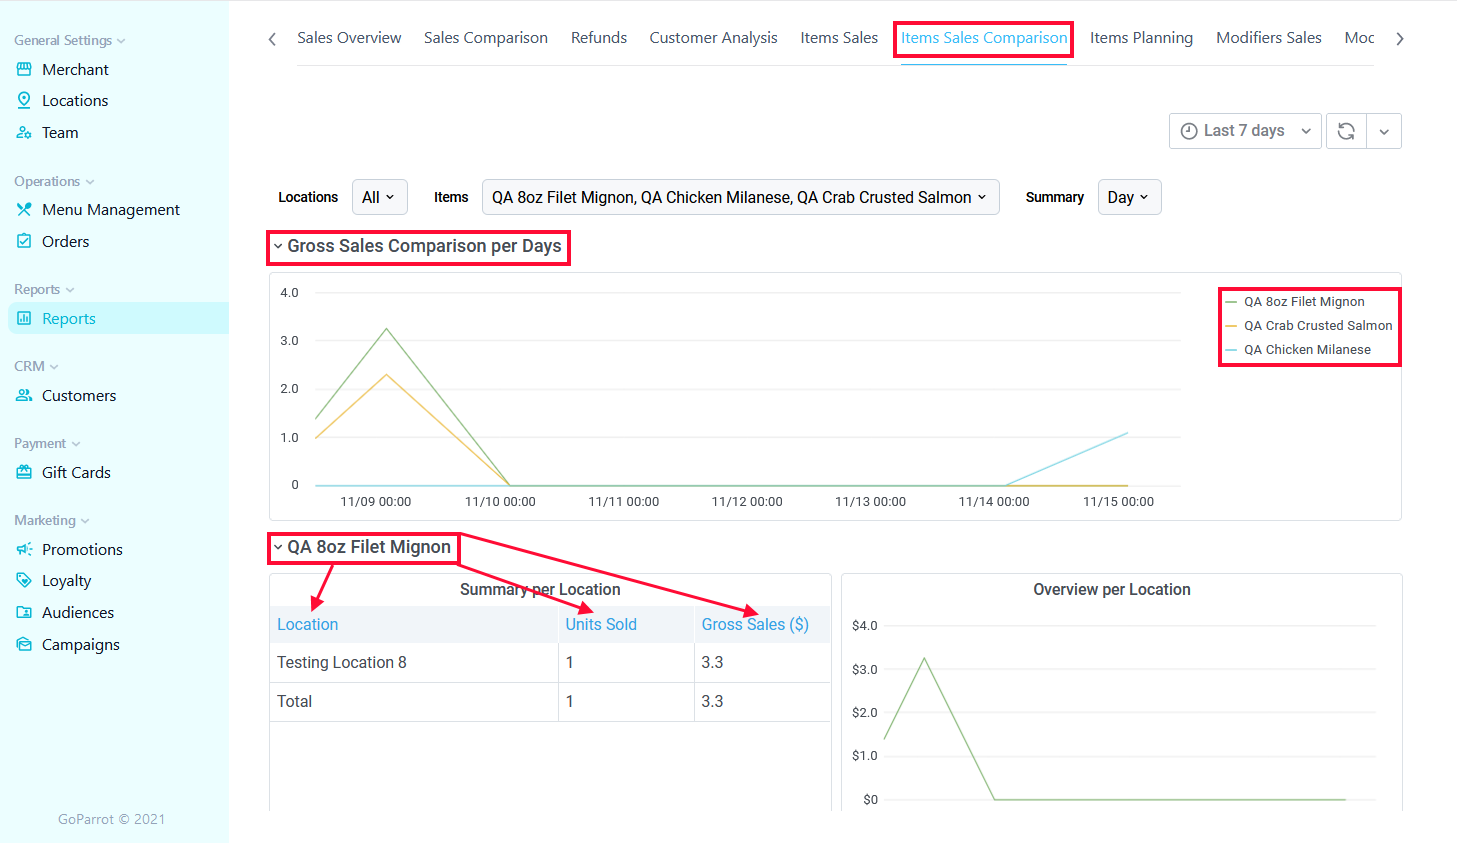
Comparative statistics of items performance in various locations. Define the required time interval using Time Picker, choose the Location and Item Names.
The graph below provides comparative data on Gross Sales ($) per Days of the items you selected.
You can also view data on Units Sold and Gross Sales per Location, as well as the graphical representation for each Item you selected.
Items Planning
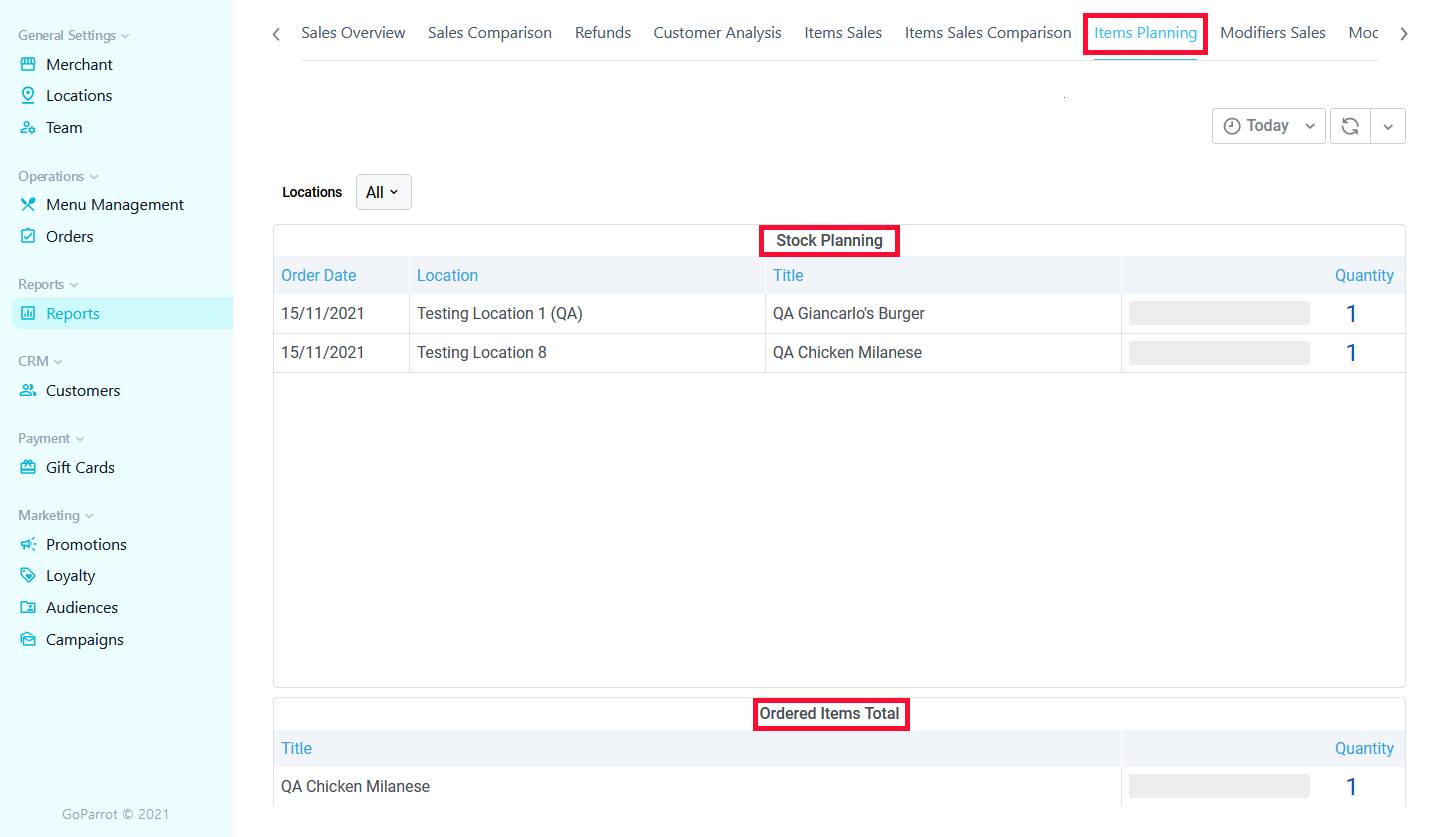
Define the required time interval using Time Picker for planning your stock with items you require. This page is important for efficient planning at the item level (food, beverage) and for staying in sync with changing customer demands.
Stock Planning – plan the dates when the items must be ordered for each location. Input the Order Day, Location, Item Title and Quantity.
Ordered Items Total – provides the name of the ordered items and the quantity for each one.
You can plan what items to order for All, one or some of your Locations.
Modifier Sales
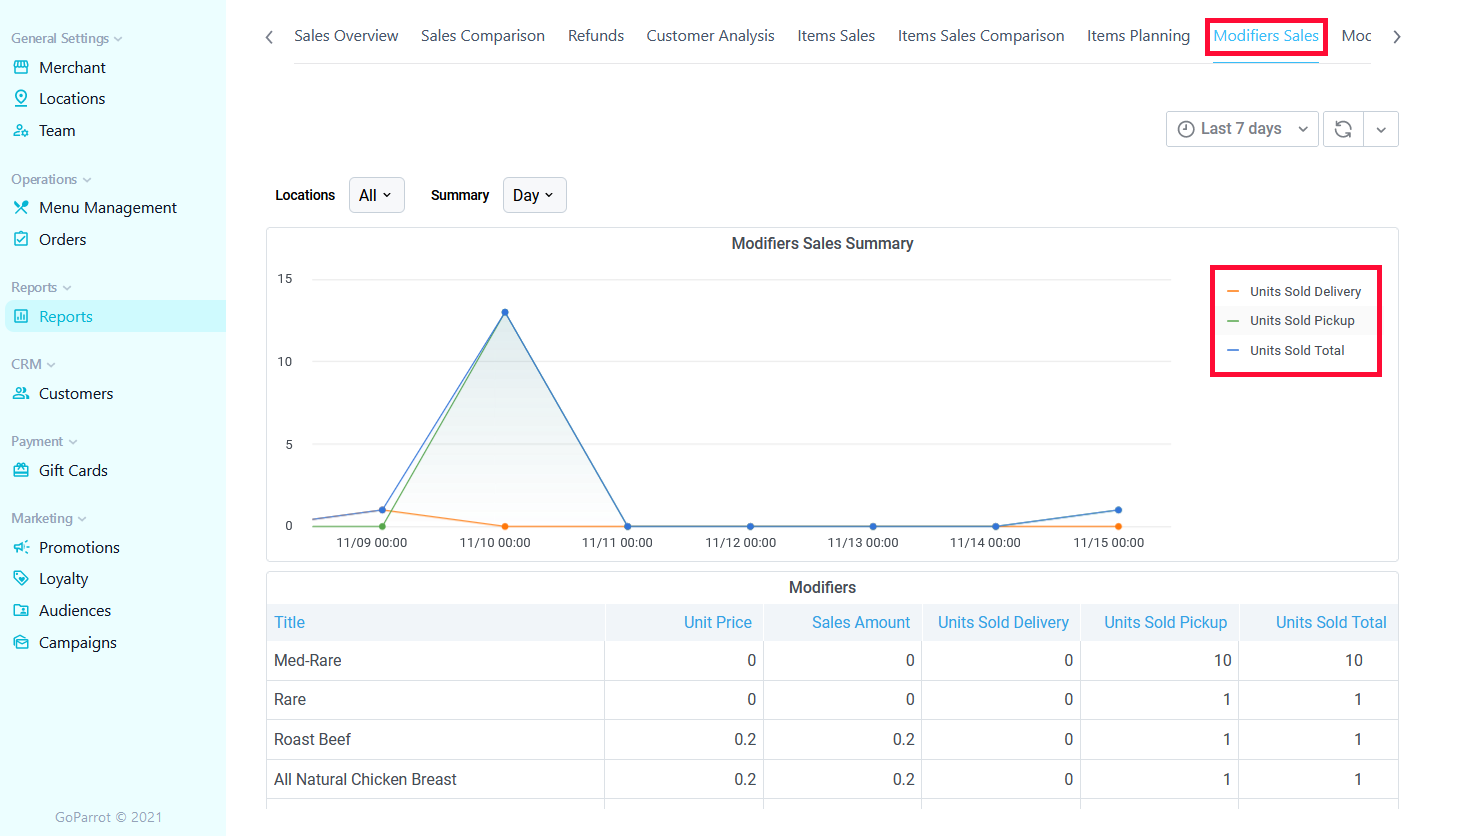
Statistical data on various modifiers sold on your online store. Define the required time interval using Time Picker.
The graph below provides data on modifiers sold through Pickup, Delivery and Total, based on a modifiers list that aslo include their Title, Unit Price and Sales Amount.
* Modifiers are groups of items, assigned to a product or category to add more details to an order, such as additional ingredients, side dishes, etc.
Modifiers Planning
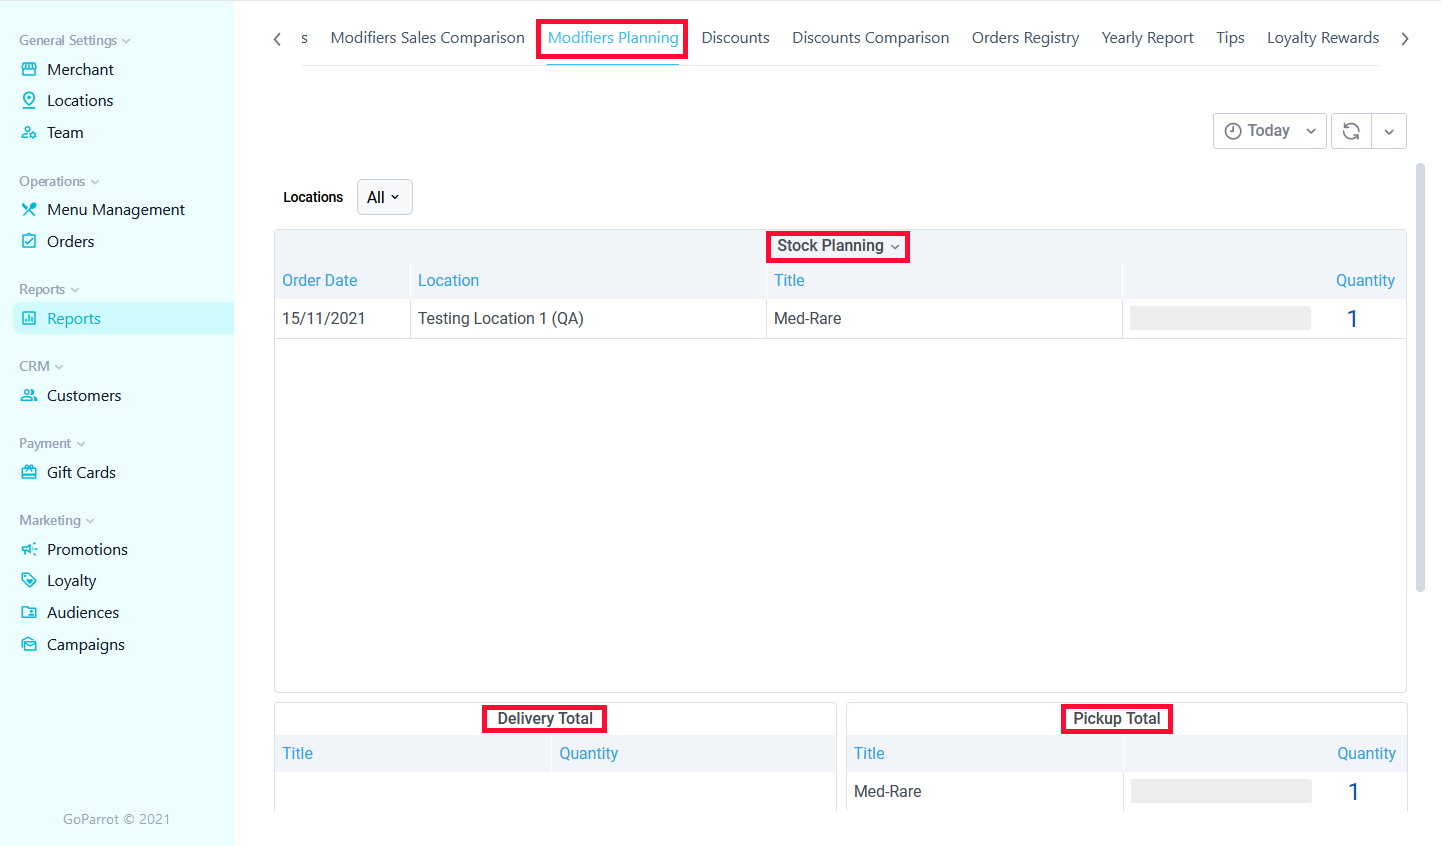
Define the required time interval using Time Picker to plan your stocks with the modifiers you require.
Stock Planning – plans the dates when the modifiers must be ordered for each location. Input the Order Day, Location, Item Title and Quantity.
Delivery Total – shows the title and the quantity of required modifiers that will be used for delivery orders.
Pickup Total - shows the title and the quantity of required modifiers that will be used for pickup orders.
Discounts
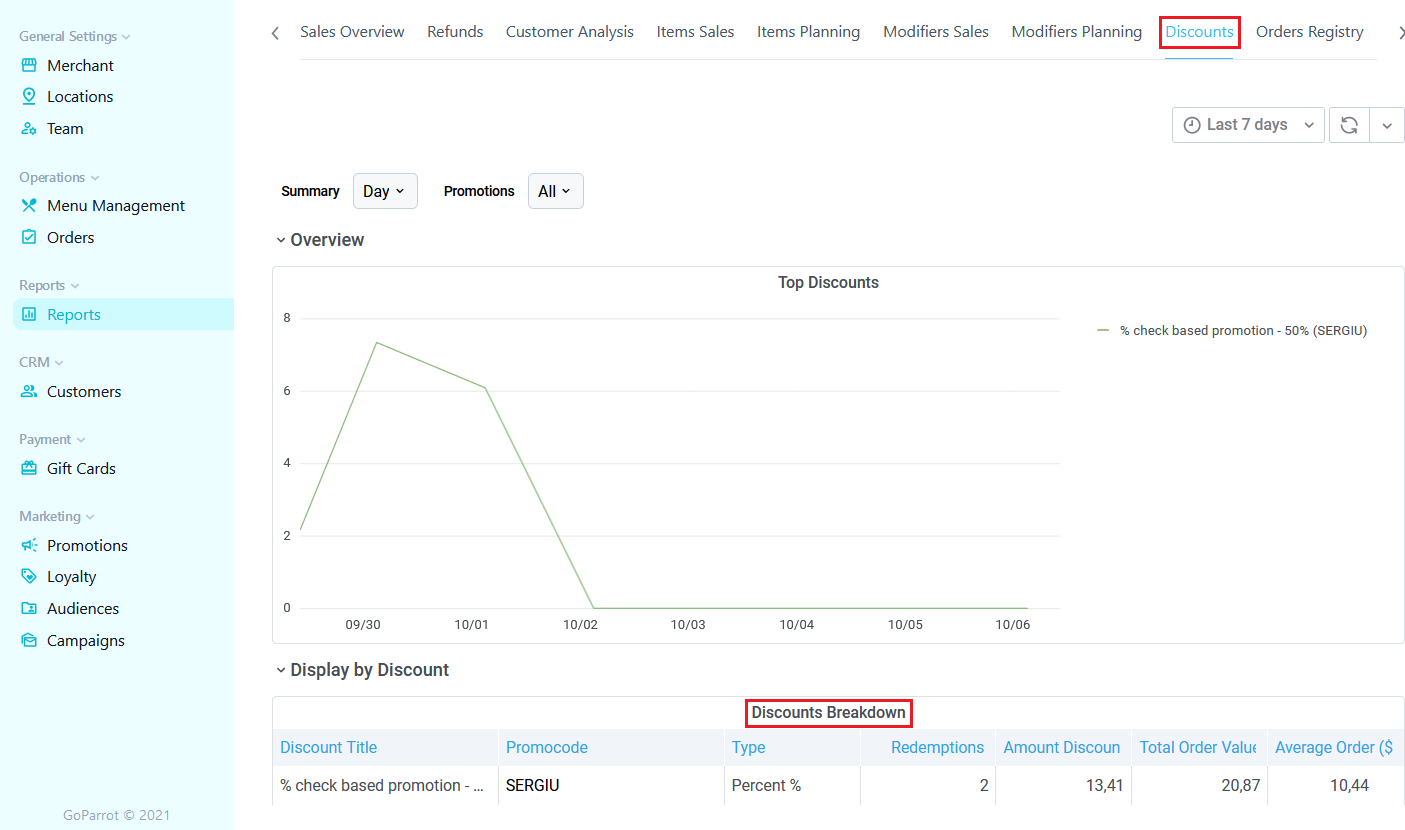
Report on discounts used by the customers in your store/restaurant. Define the required time interval using Time Picker, select Summary and Promotions (from the list you can choose a specific type of promotion or all of them).
The graph bellow shows you data on top discounts in a certain period of time. It is followed by two panels below that contain the following data:
1. Discount Breakdown
- Discount Title – the name of discount or promotion, e.g. Get 10% off Coffee.
- Promocode or Promotional Code – a code that consists of a mixture of letters and numbers, used to obtain discounts (can either be a percentage or a specific dollar.
- Type – e.g. bulk discounts, seasonal discounts, loyalty program discounts, etc.
- Redemption – amount of promotions or discounts redeemed by the customers.
- Amount discounted ($)
- Total order value ($)
- Average order ($)
2. Discount usages
View information on discounted ordersand customers that placed them:
- Order date;
- First Name;
- Phone;
- Email;
- Location;
- Order Number;
- Order Total;
- Discounted Amount;
- Promotion Title;
- Promotion Type;
- Promocode.

Discounts Comparison
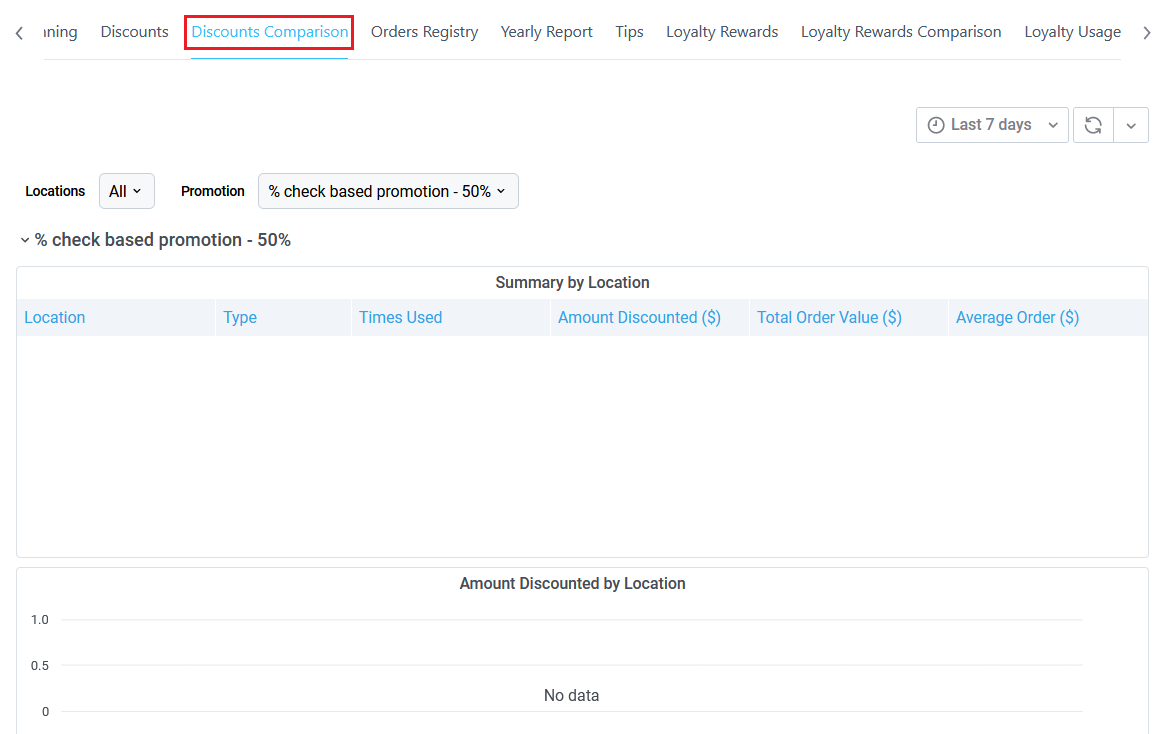
Comparative report on discounts used by your customers. Define the required time interval using Time Picker, select from the list All, one or some of your Locations and type of Promotion.
The panel below provides statistical data based on Location, type of Promotion, the number of times it was used, the Amount Discounted in $, Total Order Value in $ and the amount of the Average Order in $.
The panel is followed by a graph where you can view data on Amount Discounted by Location.
Orders Registry
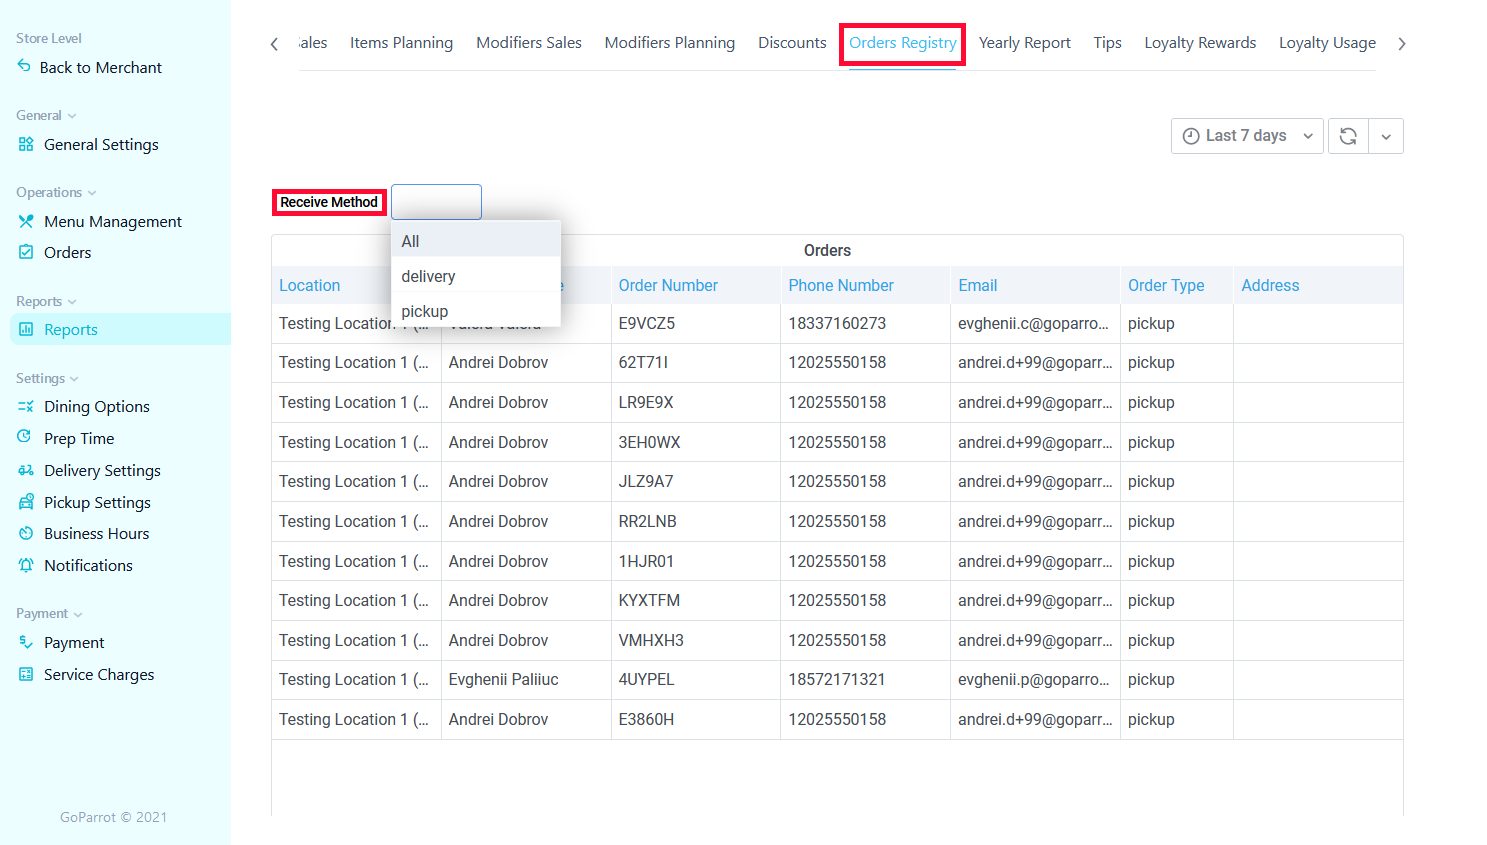
Statistical data on the orders your restaurant received from your customers.
Define the required time interval using Time Picker and choose from the list the Receiving Method: Delivery, Pickup or both (All).
On the panel below you can view the following data: Location, Customer Name, Order Number, Phone Number, Email, Order Type and Address.
Yearly Report
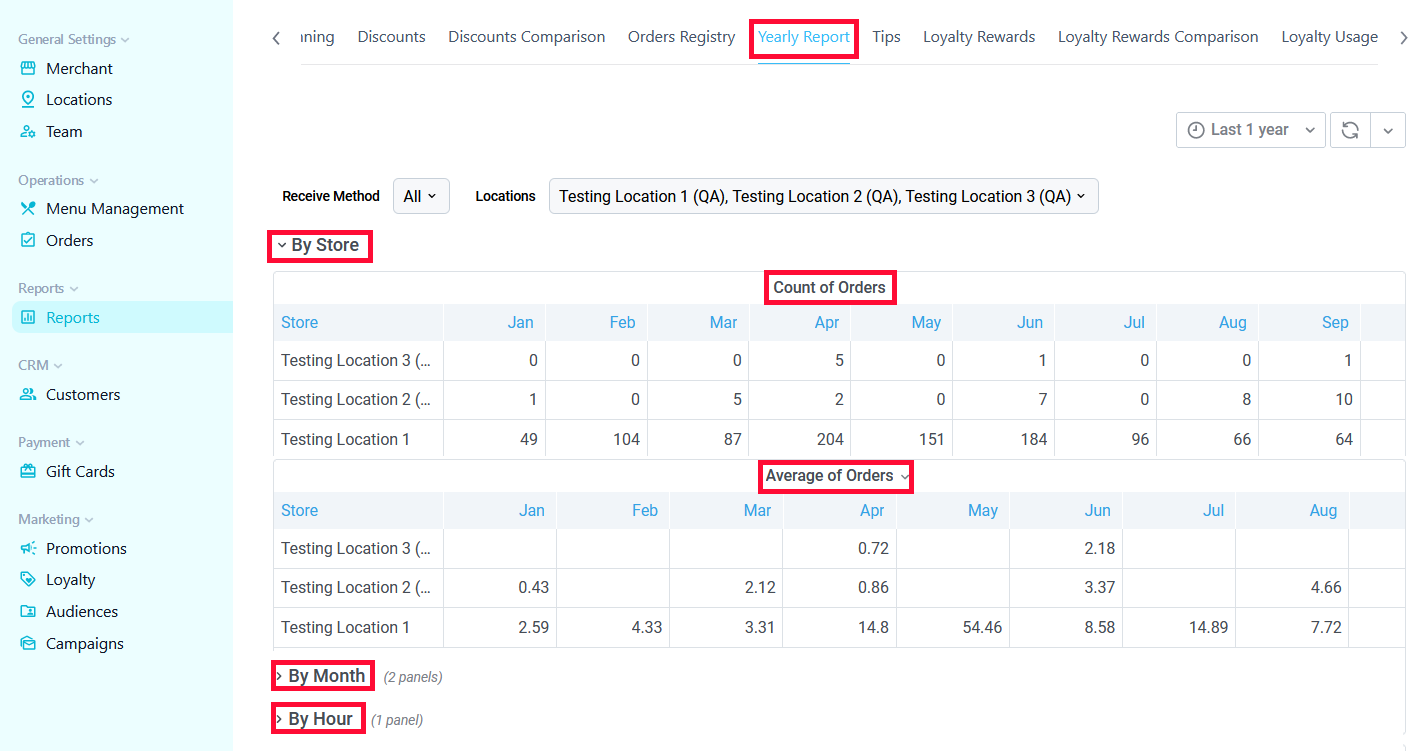
Yearly report on the orders your restaurant received from your customers. The Time Picker is set automatically to one year.
Choose from the list the Receiving Method: Delivery, Pickup or both (All), as well as one, some or All your locations to view the Total and the Average number of orders.
You will be able to view the yearly report By Store, By Month (including a comparative monthly analysis of Delivered and Pickup orders) and By Hour.
Tips
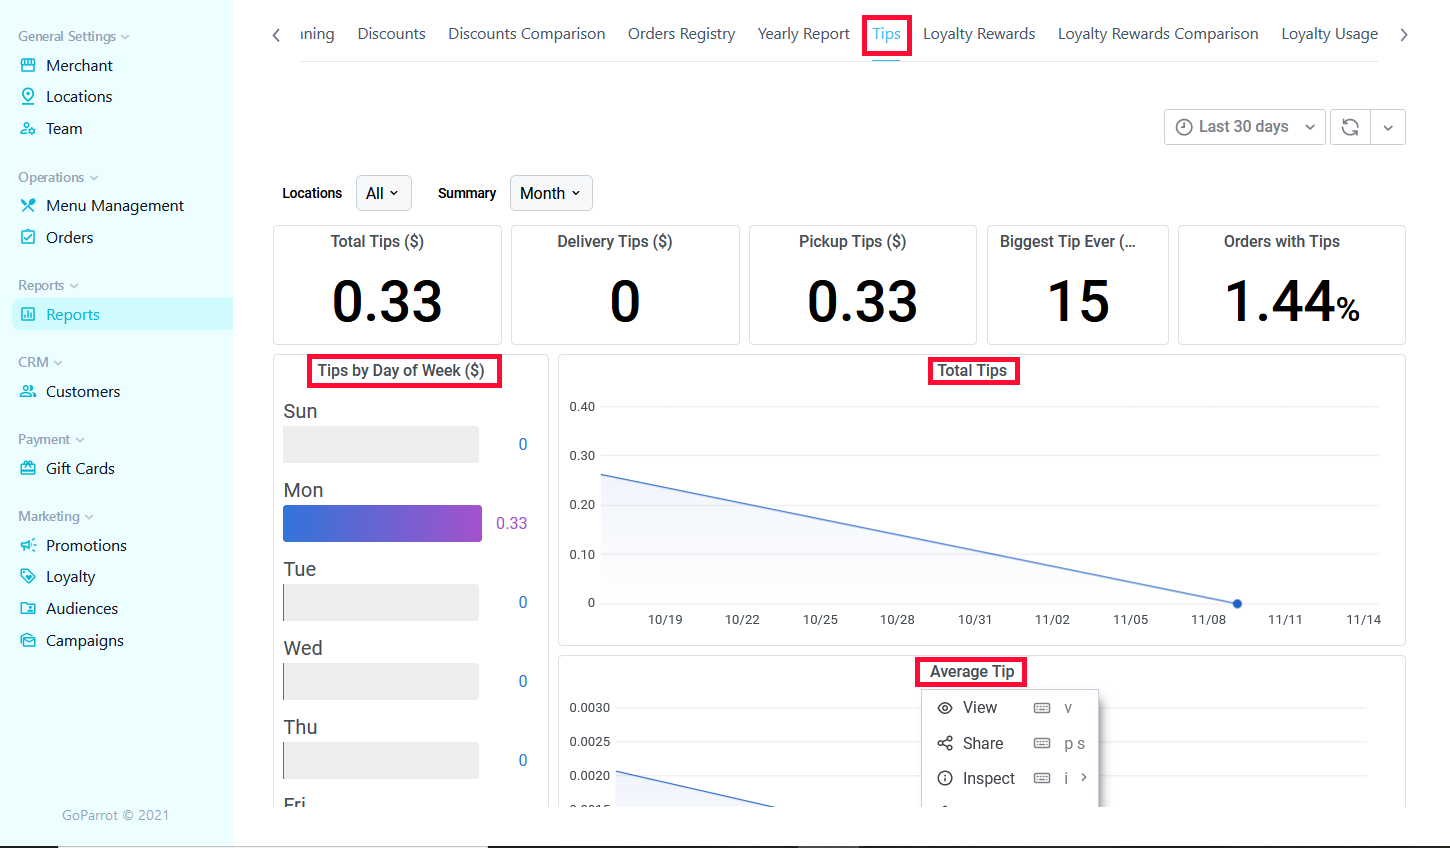
Report on the tips your restaurant received from your customers. Define the required time interval using Time Picker and select from the list All, one or some of your Locations.
The report provides the following data: Total Tips, Delivery Tips, Pickup Tips, the Biggest Tip Ever and the number of Orders with Tips.
On the graph below you can view the amount of Total Tips and data on Average Tip by Day of the Week.
Bellow, there is a panel providing reports on Tips by Location that include the Number of Orders, the amount of Total Tips in $, the value of Average Tip in $ and Total Revenue in $.
Loyalty Rewards
Loyalty rewards are an important part of marketing strategy, as they reward loyal customers who frequently engage with your business. These rewards have the goal to incentivize repeat orders by providing your customers with various discounts, unique offers, promotions, etc.
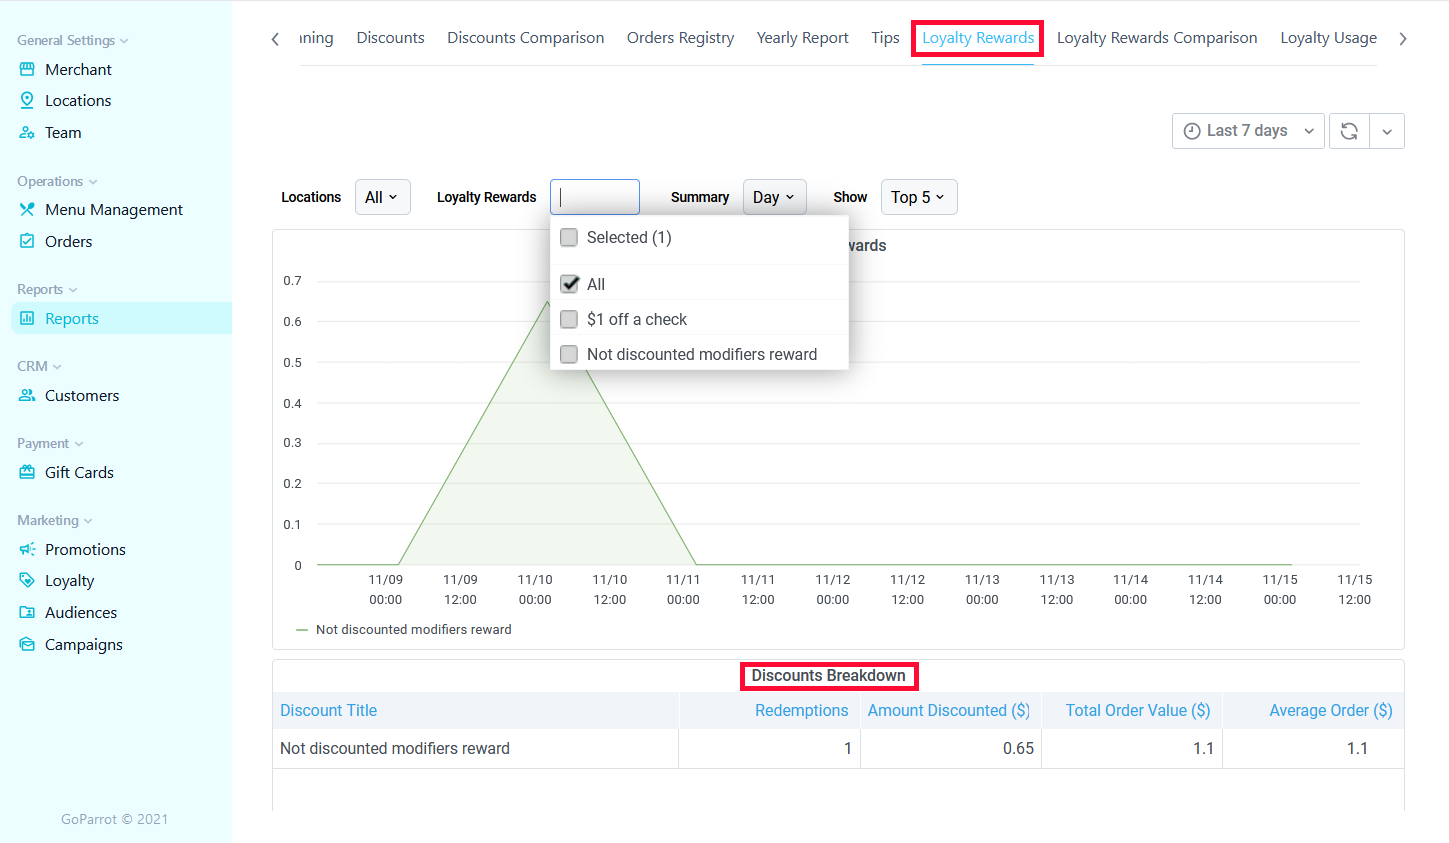
This page provides statistical data on discounts and loyalty rewards for your customers. Define the required time interval using Time Picker, select from the list All, one or some of your Locations.
Select Loyalty Rewards (from the list you can choose a specific type of reward, e.g. %50 off an item or 15% off a category, or All of them), and Summary where you can view All the rewards, Top 5, Top 10 or Top 20.
The graph below provides statistical data on All or certain types of Loyalty Rewards in a given time interval.
The Discount Breakdown panel below displays the Discount Title, Redemptions, Amount Discounted in $, Total Order Value in $ and the amount of Average Order in $.
Loyalty Rewards Comparison
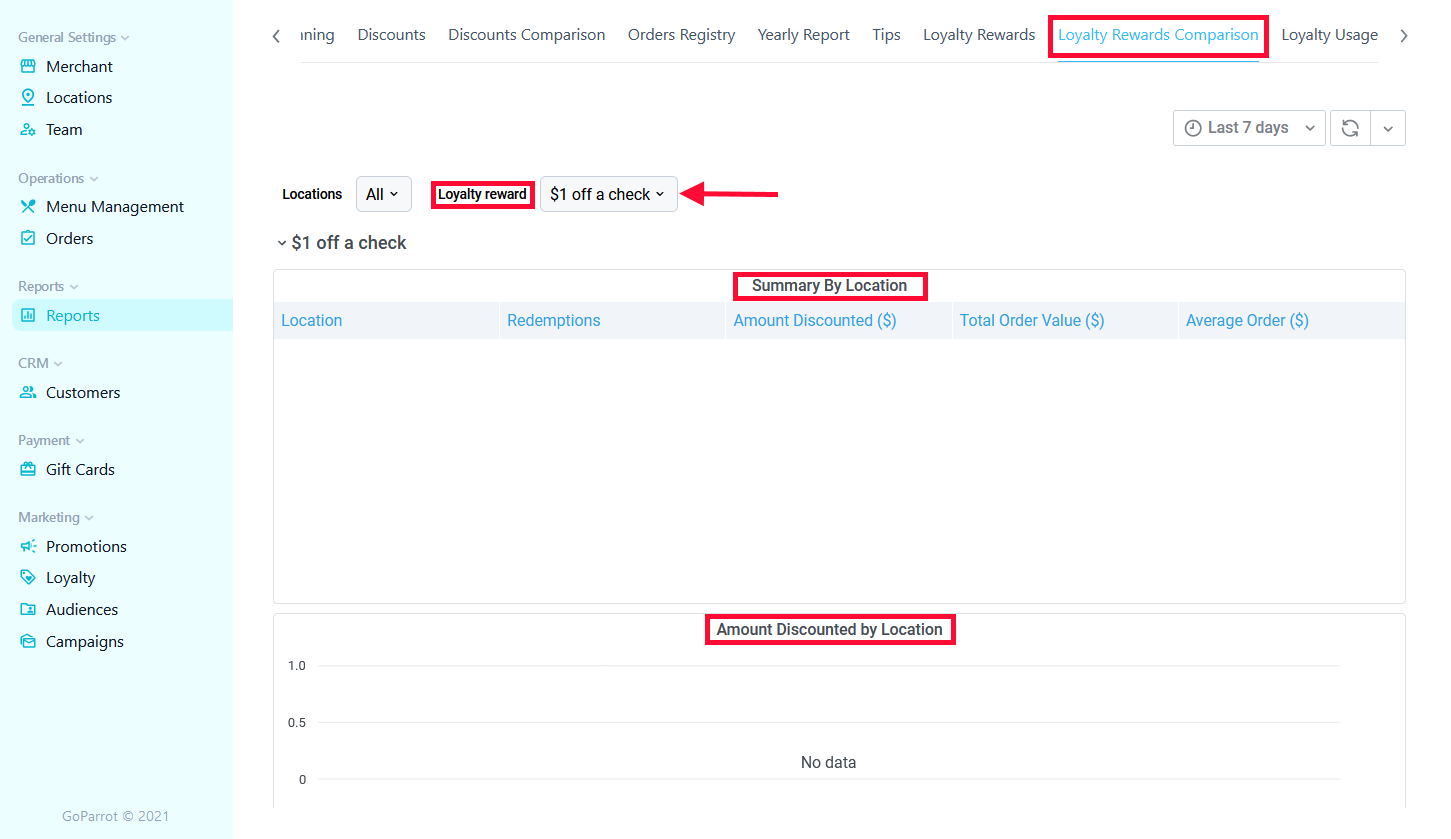
Comparative data on Loyalty Rewards used by your customers. Define the required time interval using Time Picker, select from the list All, one or some of your Locations, then select the Loyalty Reward (from the list you can choose a specific type of reward, e.g. %50 off an item or 15% off a category, etc).
The panel below provides general data on a certain type of Loyalty Reward, that includes Location, Redemption, Amount Discounted in $, Total Order Value in $ and Average Order in $.
The panel is followed by a graph that show data on Amount Discounted by Location.
Loyalty usage
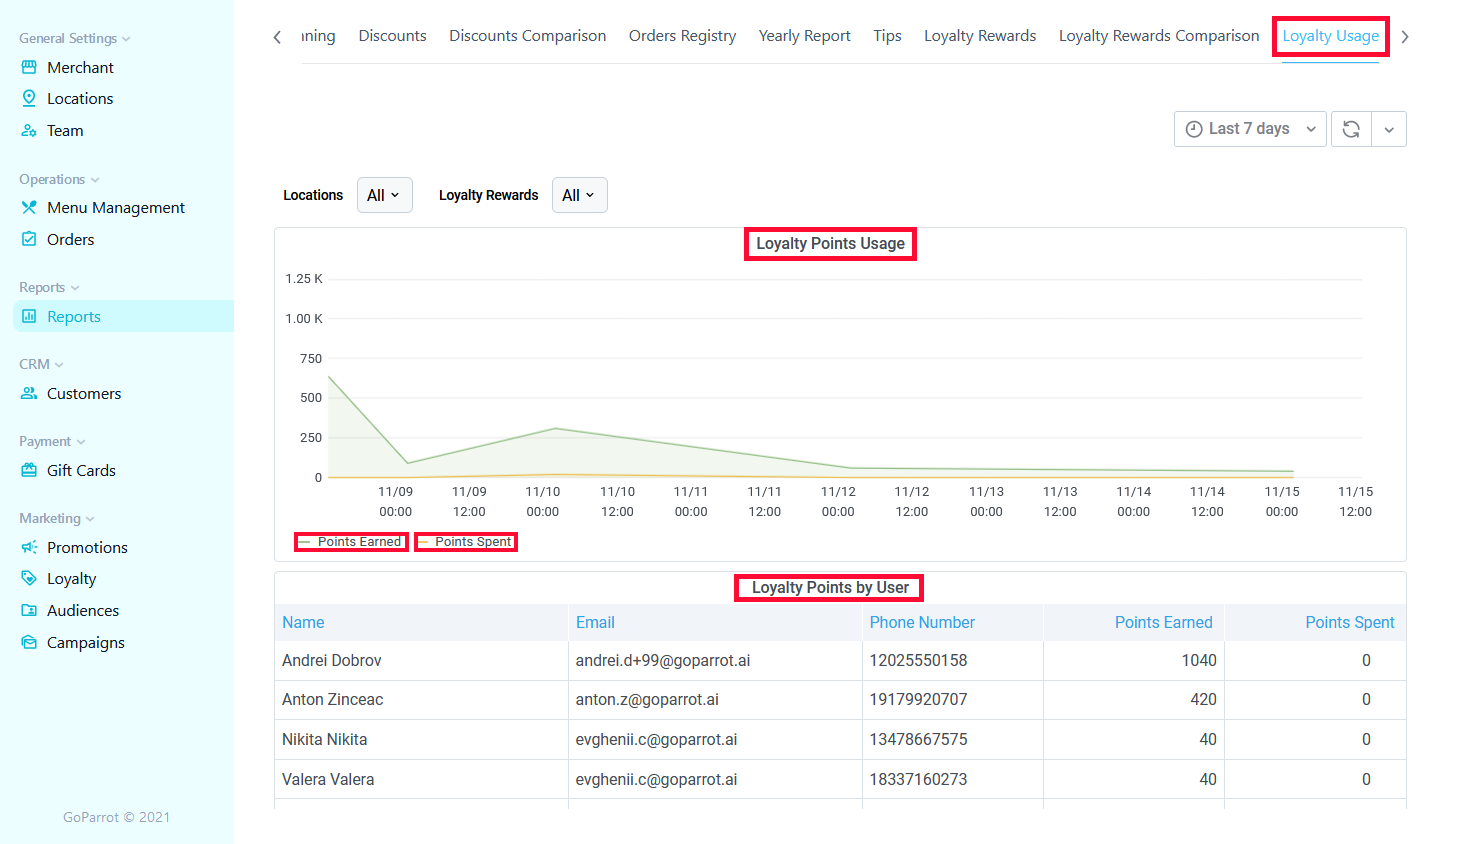
Statistical data on Loyalty Rewards/ Points that were used by your customers. Define the required time interval using Time Picker, select from the list All, one, or some of your Locations, select Loyalty Rewards/Points (from the list you can choose a specific type of Loyalty Points, or All of them).
The following graph shows the selected Loyalty Points Earned and Spent in a given time interval.
The panel below provides general data on Loyalty Points Usage by Users, including users’ Name, Email, Phone Number, Points Earned and Points Spent.
Export Data#
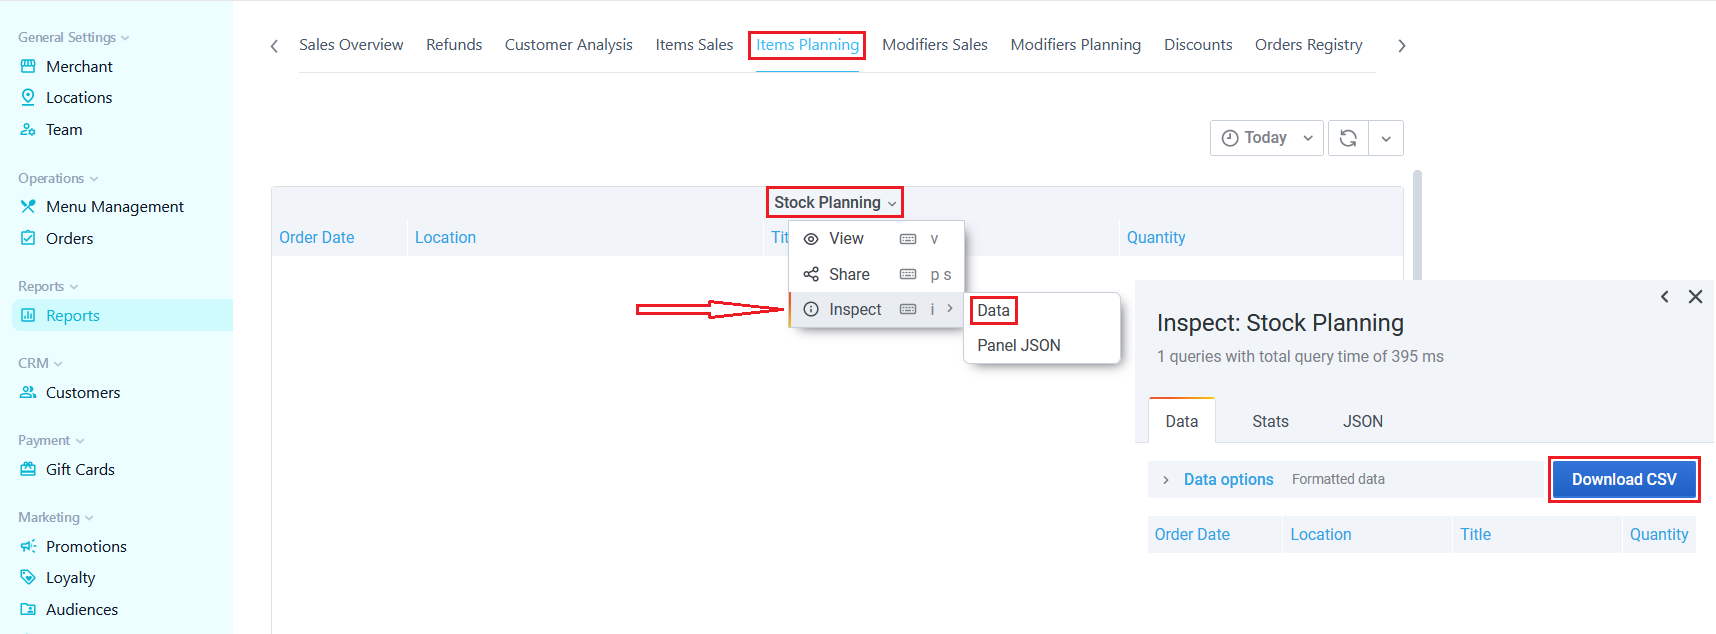
You always have the opportunity to export statistical data for a certain component (e.g. Item Sales, Item Planning, Modifier Sales, etc.)
- Choose the required component (e.g Items Planning) and click on it.
- Select Inspect, then click on Data.
- In the new pop-up window, press Download CSV Button and save the information you require as Excel document.
